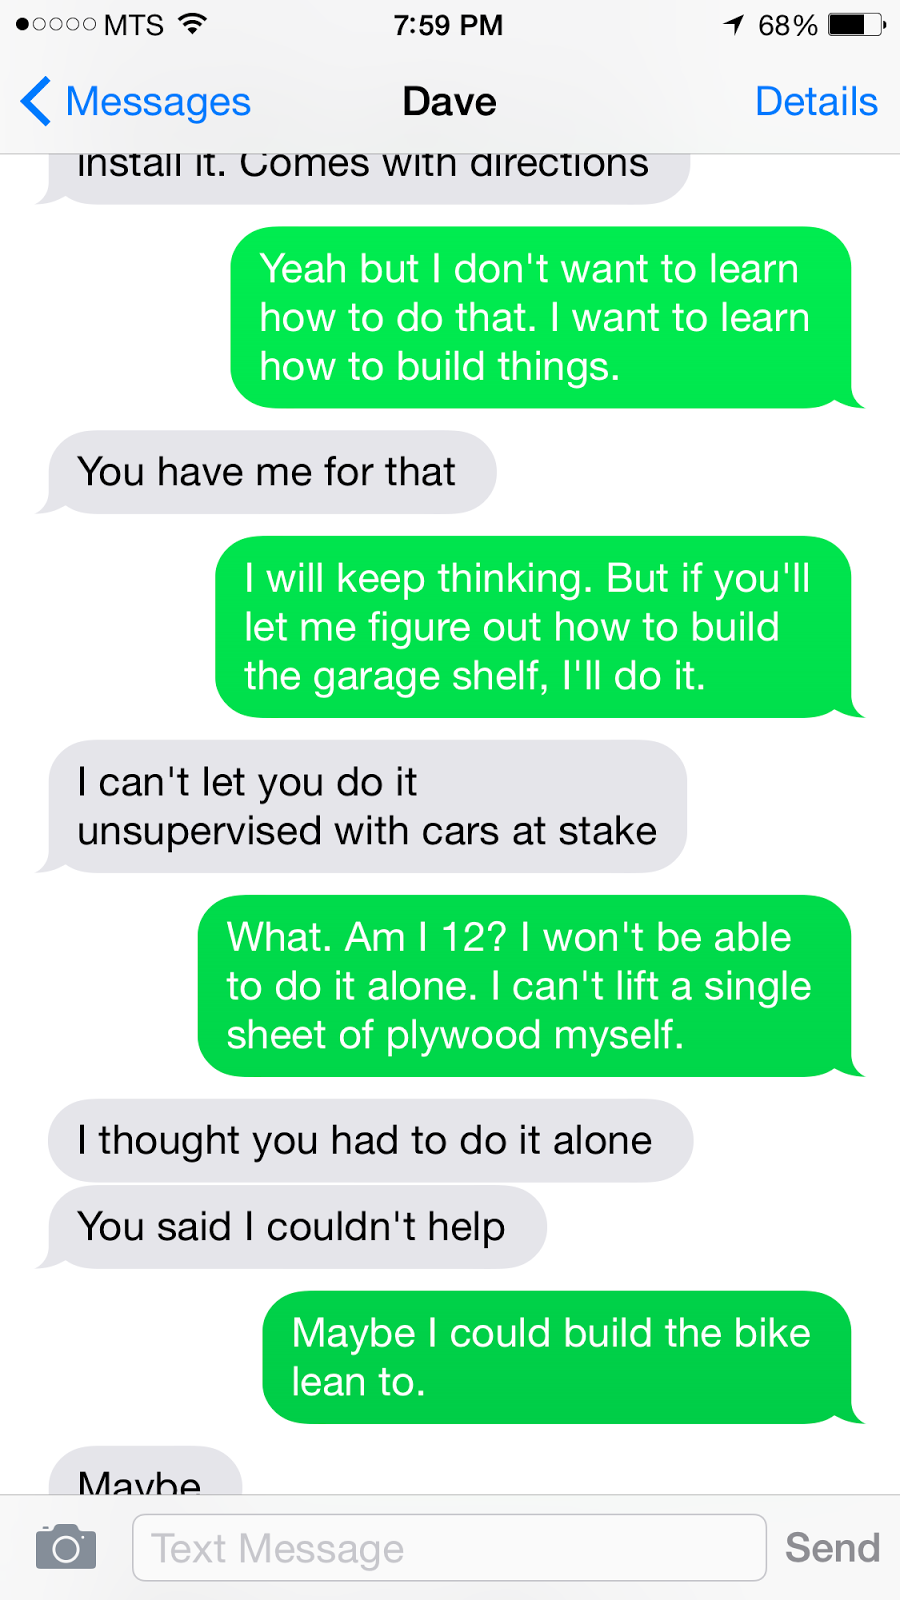
The inquiry project was a tough one for me. I had difficulty coming up with a topic because I'm in a state of life right now where it would be cool to learn something completely new (like quilting, for example.... I would like to learn to quilt) but if I am going to dedicate 6 hours to a project, right now it better be to contribute to my learning on a project I must complete -- because there are many of them on the go right now. There were several home improvement projects that fell on that list, but my significant other is fussy. He loves doing that kind of thing so much, to the point that he wants to be the one that does it all. Hence our conversation by text the first night of class about what I could build for this project. Sigh...... I love him. (P.S. I'm a feminist, really, I am).

But in doing my reading for a research project I am currently working, it struck me that I not only could I, with some self-study, replicate some of the tests done on the questionnaire described in the dissertation I was reading, but I could also use it for my project. And so the psychometrics project was born.
Learning the statistical procedures turned out to be not that difficult but it did take me most of a work day to put it all together. The presentation had it's own challenges because it was hard to describe what was going on in each slide in such a way that it would only take 15 seconds to read. I feel I make a few leaps of understanding in my descriptions but I did the best I could to keep it brief but still make it understandable and interesting.
Interestingly enough, I have opportunity to use this format again at the Manitoba Cycling AGM, as we were invited to do a presentation on women and cycling but were only given 5 minutes. No problem!
Below is the script to the video that is imbedded above. Please enjoy.
1. Psychometrics are the statistical tests performed on a questionnaire to assess if that questionnaire is performing consistently and measuring what it says it is measuring.
2. Usually when I do research, I hire a statistician. Here is my statistician, Tom Harrigan. Statisticians don’t have time to think about petty things like office cleaning when they are performing mathematics on data so here is Tom on a day that he cleaned his office and we were all amazed
3. The questionnaire I developed was an instrument used to measure Writing
Self-Efficacy. It uses a 4-point Likert
scale measuring agreement to disagreement on 10 items related to confidence in
writing ability. The lowest possible
score on this questionnaire is 10 and the highest is 40.
4. The inspiration for this project came when I was reading a dissertation
describing the psychometrics of a similar scale designed for Adult Basic
Education Students. I felt that I could
replicate many of the statistical procedures explained in this dissertation.
5. One of the key psychometric testing procedures is Factor Analysis. I
took Biostatistics in 2002 when I was in the masters of nursing program. I found my old textbook and notes hoping
there would be information on Factor Analysis …… but there wasn’t.
6. So I asked statistician Tom what he thought about my project and he
told me I needed more than 6 hours to learn Factor Analysis. And given the
complexity of the formulas for factor analysis, I could see what he meant. So I performed some of the other tests
described in the dissertation instead.
7. A program like SPSS is much more efficient for statistical analysis but
for this project, I had to go with what I had, which was Excel. By using you
tube videos, I learned how to draw graphs, perform correlation, and create
binned tables.
8. So, I pooled the data collected from 231 participants over two past
studies. I reordered the data so that the total scores from the questionnaire
were ranked from lowest total writing self-efficacy to the highest. The lowest
score in the sample was 15 and the highest was 40.
9. Many of the statistical tests I performed required analyzing each
question by comparing the top 25% to the bottom 25% of the sample. Strong
questions would show low writing self-efficacy students disagreeing, and high
self-efficacy students agreeing with the statements on the questionnaire.
10. For example: Question 1: “I feel I have the skills to write a scholarly
paper” can be considered a successful question, as can be seen in this plot mapping
the number of strongly disagree, disagree, agree or strongly agree responses
provided by both the low and high writing self-efficacy participants.
11. I also experimented with using an online stats calculator from a
QuickCalcs website to calculate mean, standard deviation, and perform T-tests
both on each question, comparing the highest and lowest scoring students, as
well on the total sample of 231.
12. Using question 10 as an example: The independent group T-test successfully
showed that all the individual questions demonstrated statistically different
means between the low and high writing self-efficacy group which shows the
questionnaire could correctly identify these opposing groups.
13. The dissertation I followed suggested that each individual question
should have a mean score between 2 and 3 and a standard deviation between 0.5
and 1, when these tests are performed on the total sample of 231.
14. You’ll see by the arrows that question 3 met the criteria for the mean
but did not meet the criteria for Standard deviation “SD” where it scored below
.5. Question 4, however, met the
criteria for both mean and standard deviation.
15. Now for the hard part….the gratuitous selfie! What does this all mean? And who cares? It required a lot of thinking
on my part.
16. Most questions faired like question 8:
The mean fell between 2 and 3, the standard deviation fell between 0.5
and 1 and high self-efficacy students (in blue) were more likely to agree or
strongly agree with the question, while low self-efficacy students (in red) were
more likely to disagree or strongly disagree.
17. Compare that to question 3 which, as already indicated, had a low standard
deviation of .45. The graph shows that
low self-efficacy students (in blue) were just as likely to “agree” with the
statement as high self-efficacy students (in red). Suggesting there was not
enough variability in the data.
18. A similar observation can be made with question 9 where the mean score
was greater than 3. The graph shows that low and high self-efficacy students
were both likely to agree with the question presented. Subjective analysis is then important to
suggest why these questions were not as strong as the others.
19. Question 3 may be measuring a general ability to overcome difficulties
while question 9 may be measuring a general ability to be on time, rather than
measuring these behaviours as specific to writing. Likely both these items need
editing or removal from the questionnaire.
20. In conclusion. I gathered some important information about my
questionnaire. And it has made me more determined to eventually learn Factor
Analysis. This image shows me
brainstorming the possible factor categories for my questionnaire. Thank you.
Learning the statistical procedures turned out to be not that difficult but it did take me most of a work day to put it all together. The presentation had it's own challenges because it was hard to describe what was going on in each slide in such a way that it would only take 15 seconds to read. I feel I make a few leaps of understanding in my descriptions but I did the best I could to keep it brief but still make it understandable and interesting.
Interestingly enough, I have opportunity to use this format again at the Manitoba Cycling AGM, as we were invited to do a presentation on women and cycling but were only given 5 minutes. No problem!
Below is the script to the video that is imbedded above. Please enjoy.
1. Psychometrics are the statistical tests performed on a questionnaire to assess if that questionnaire is performing consistently and measuring what it says it is measuring.
2. Usually when I do research, I hire a statistician. Here is my statistician, Tom Harrigan. Statisticians don’t have time to think about petty things like office cleaning when they are performing mathematics on data so here is Tom on a day that he cleaned his office and we were all amazed
No comments:
Post a Comment